Power Platform Monitoring
Content
Introduction
The Monitoring feature provides observability during actions within the D365 systems. Individual components can be analyzed for their runtime performance to identify any parts that may slow down the system.
For information about dataverse plugins: Use plug-ins to extend business processes (Microsoft Dataverse) - Power Apps | Microsoft Learn
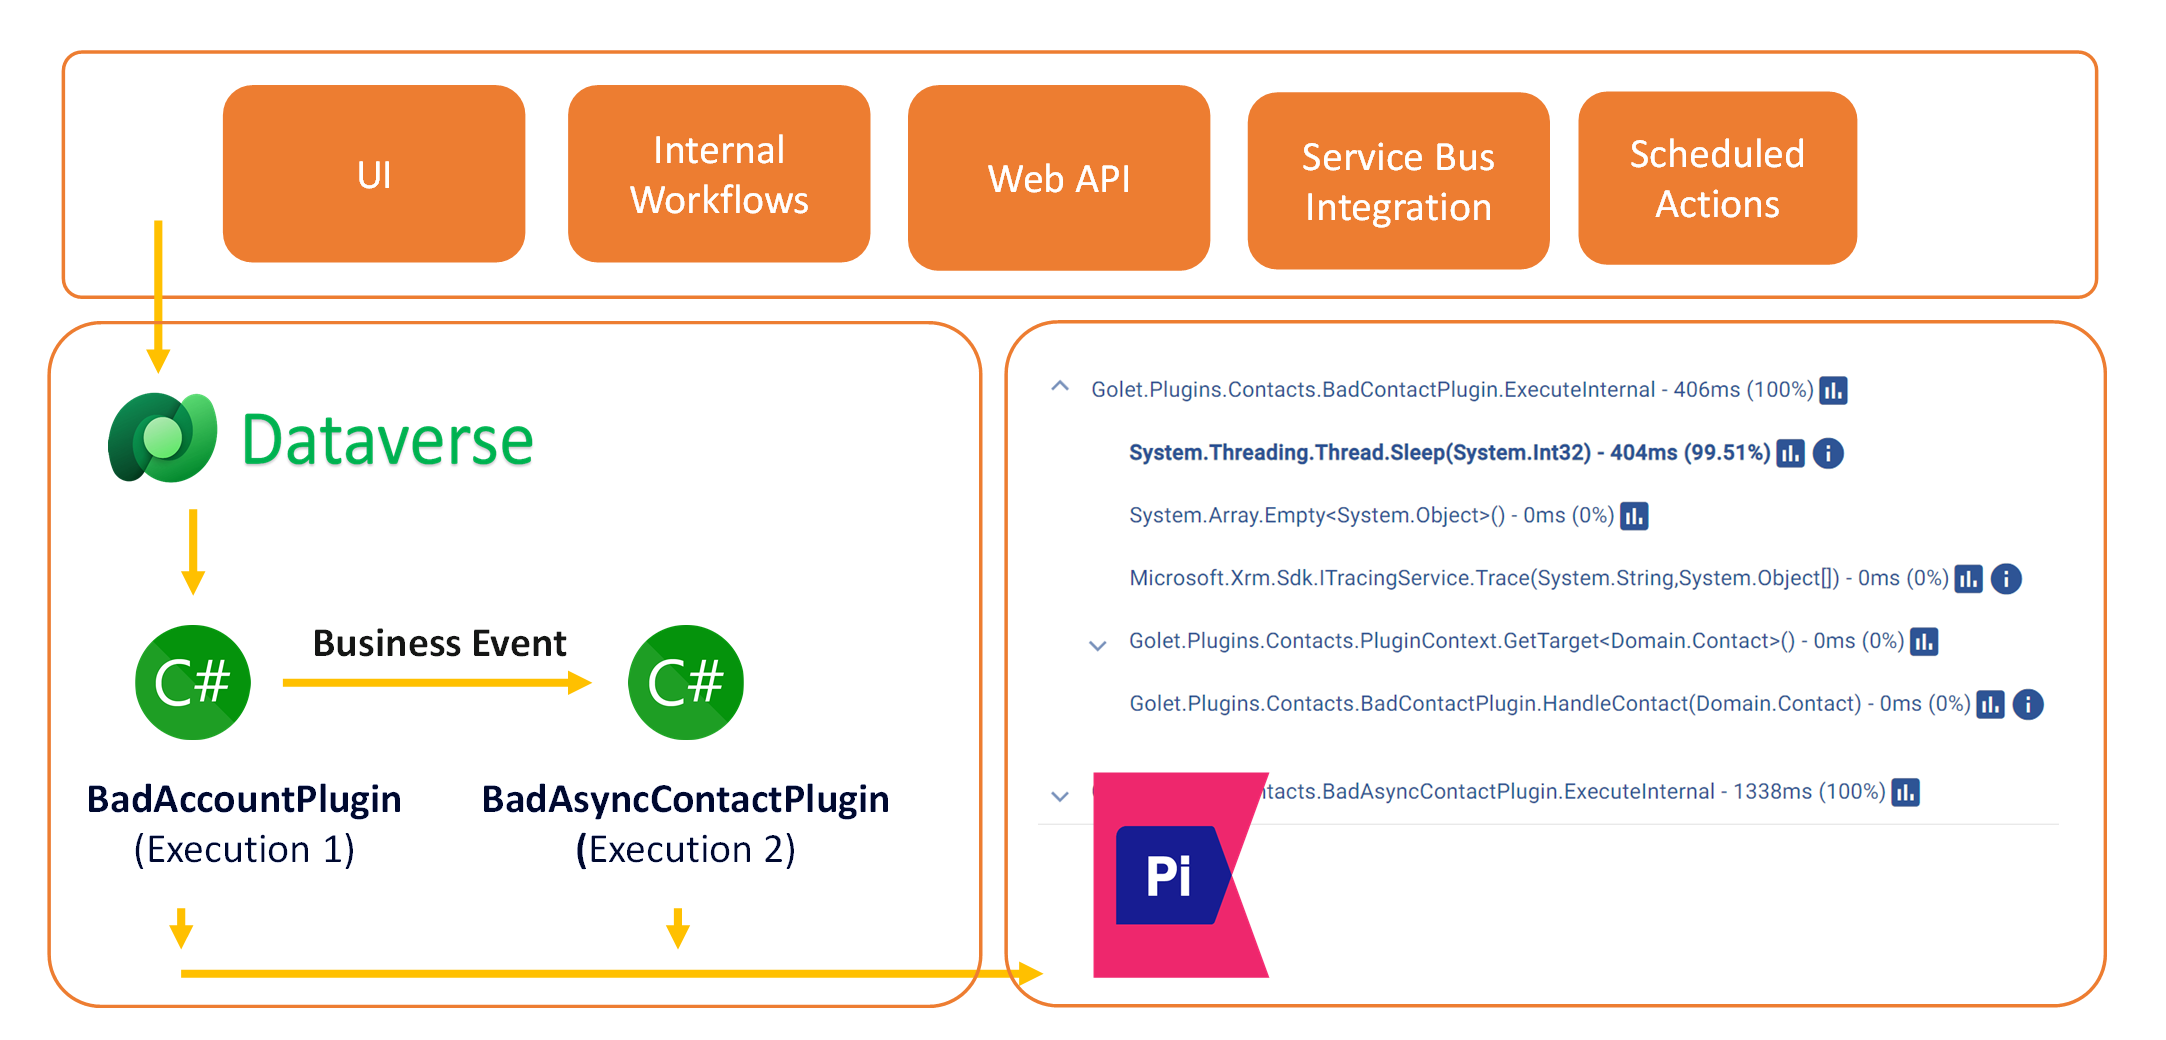
Any action within dataverse can trigger custom code (plugins) via business events. These executions will be traced and automatically stored.
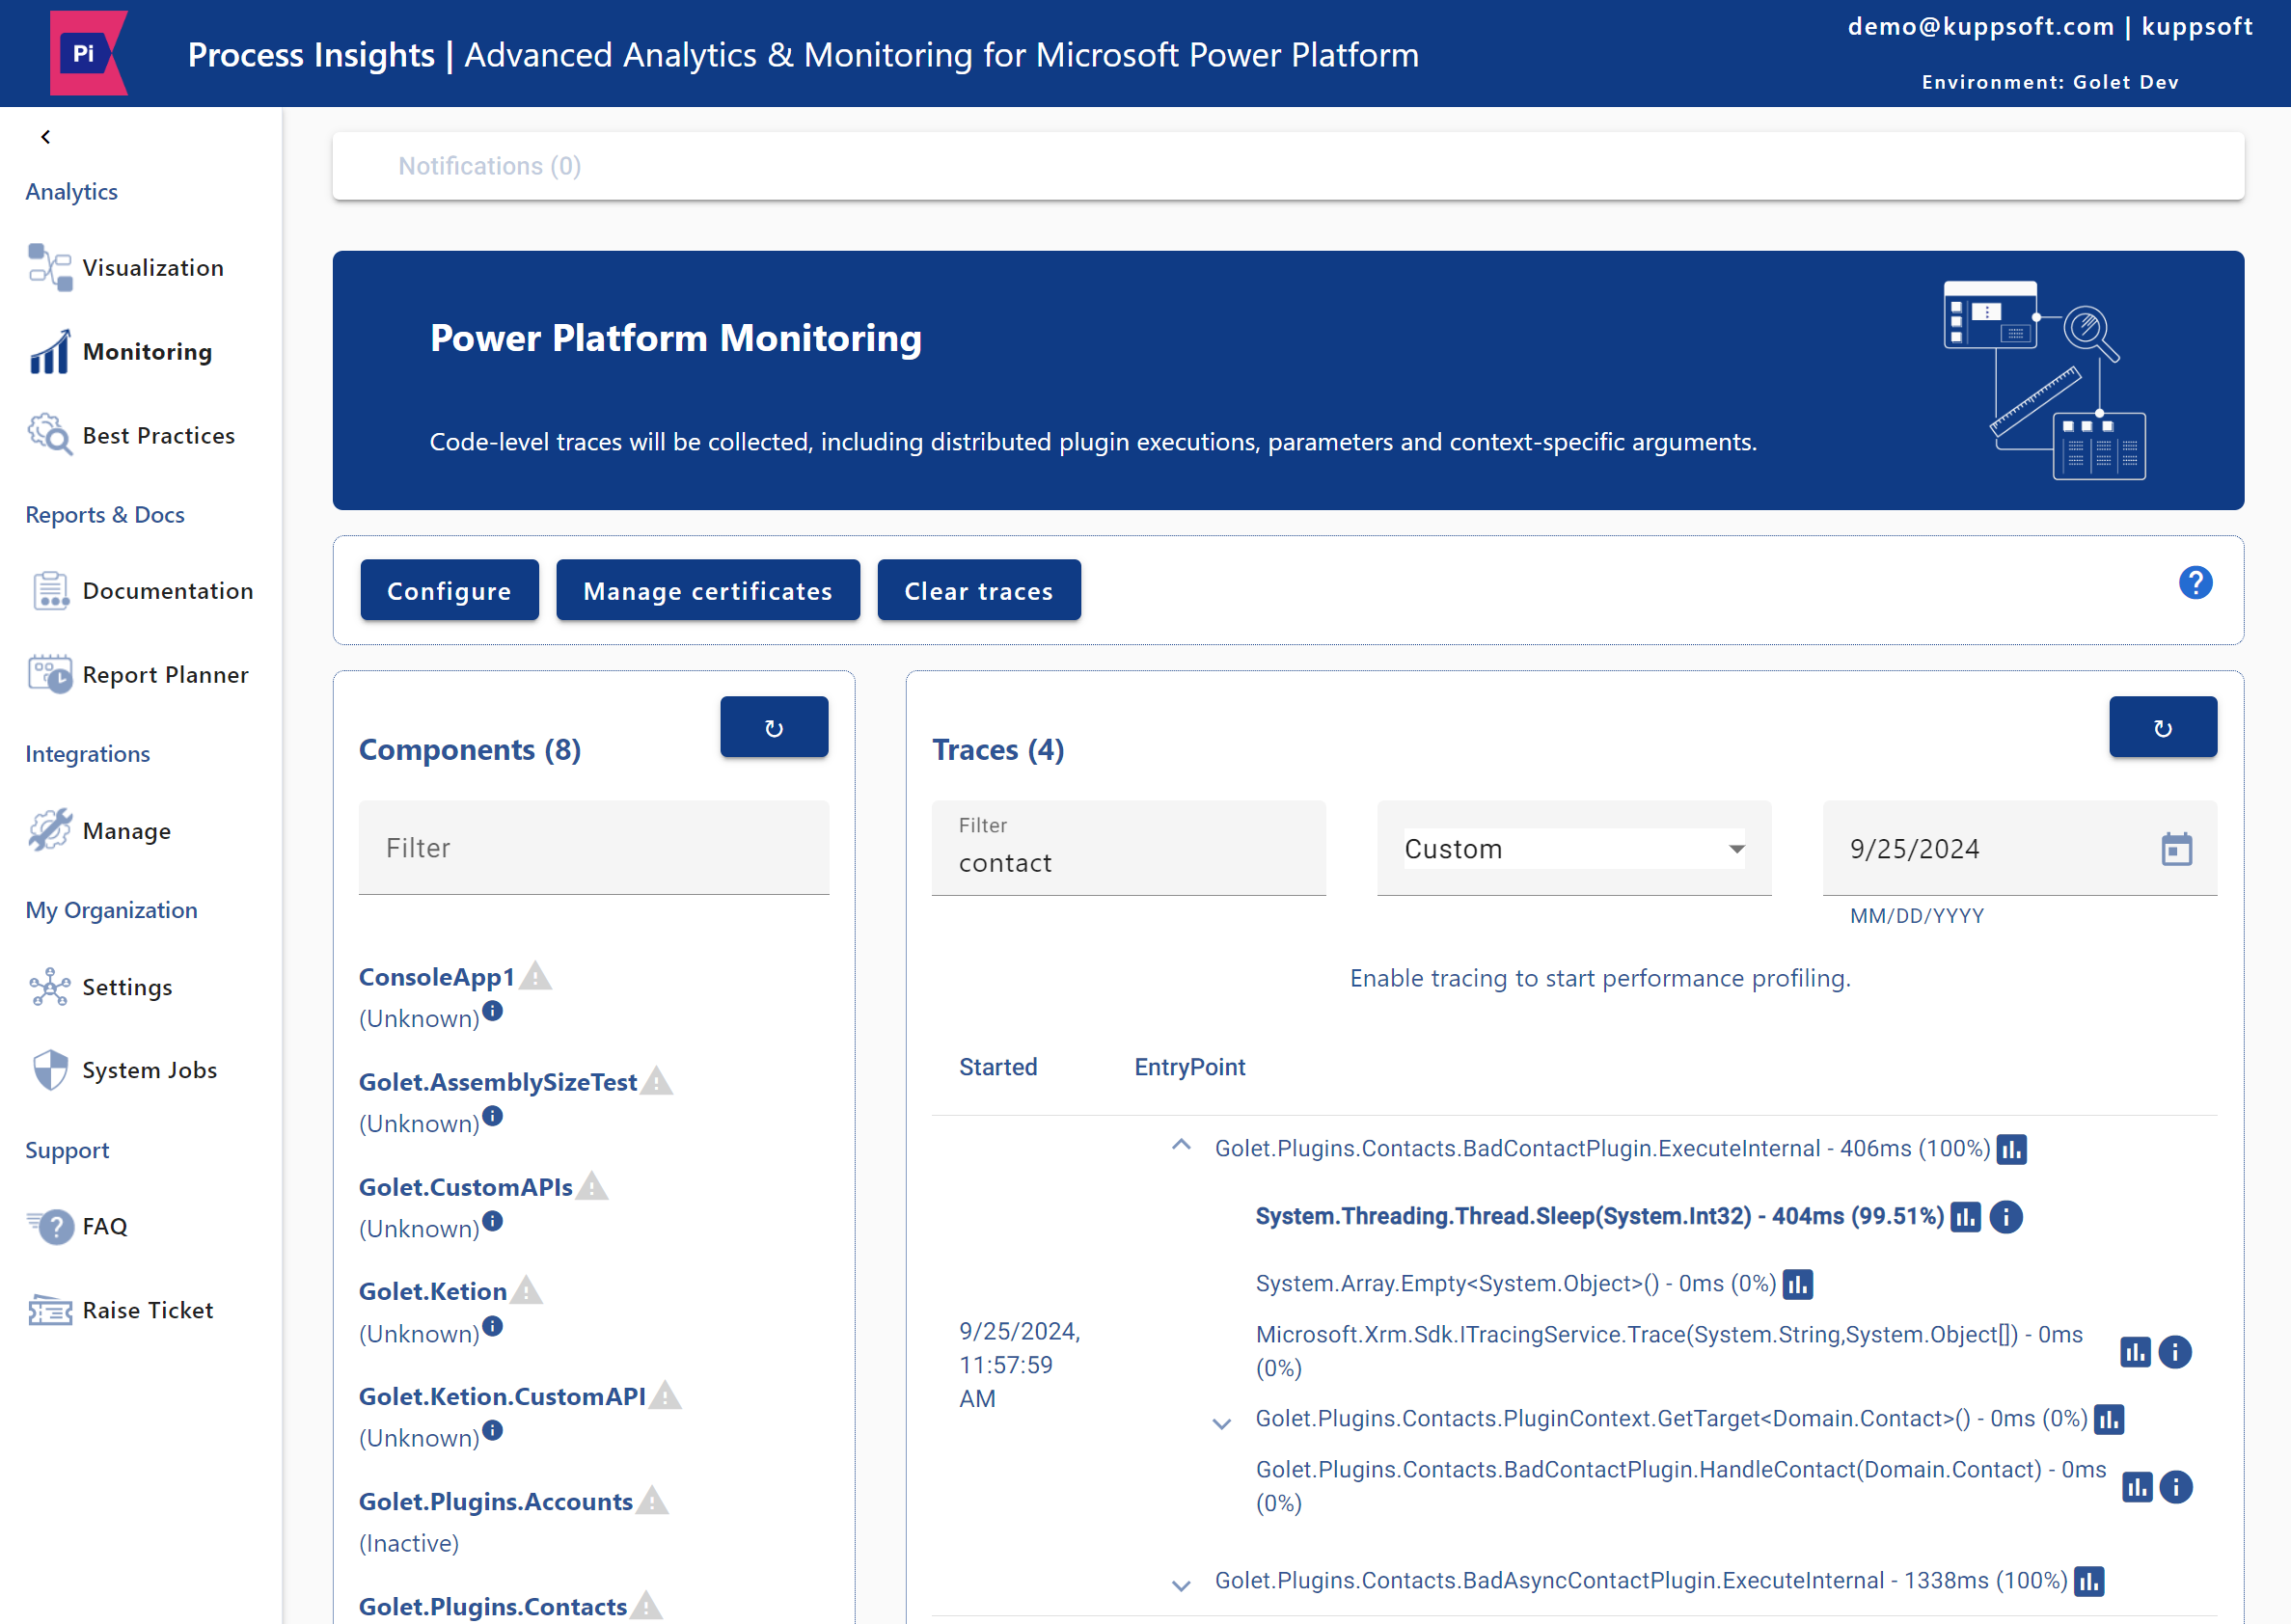
Overview
Code tracing is focused on server side code only. Real-time user tracking is based on client side code, which is not fully support yet. See Supported Systems and Components
Configure: Trace level configuration.
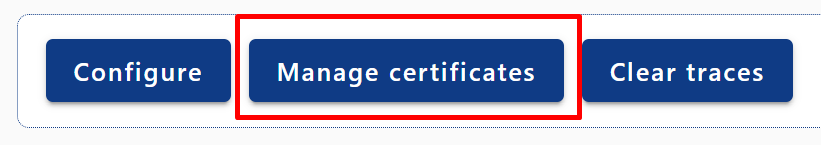
Manage certificates: Upload code sign certificates.
Clear traces: Delete all traces.
Components: Assemblies within Dataverse. A new assembly will be automatically detected.
Traces: Code executions within Dataverse. All traces are grouped by correlation id.
Setup
The initial Setup must be completed first.
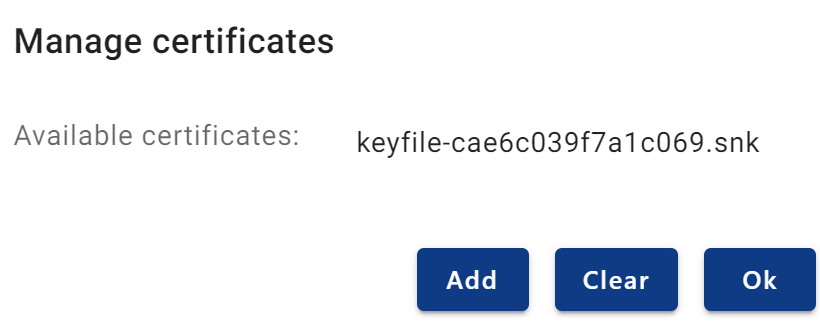
Upload your code sign certificates. SNK files (*.snk).
Configure

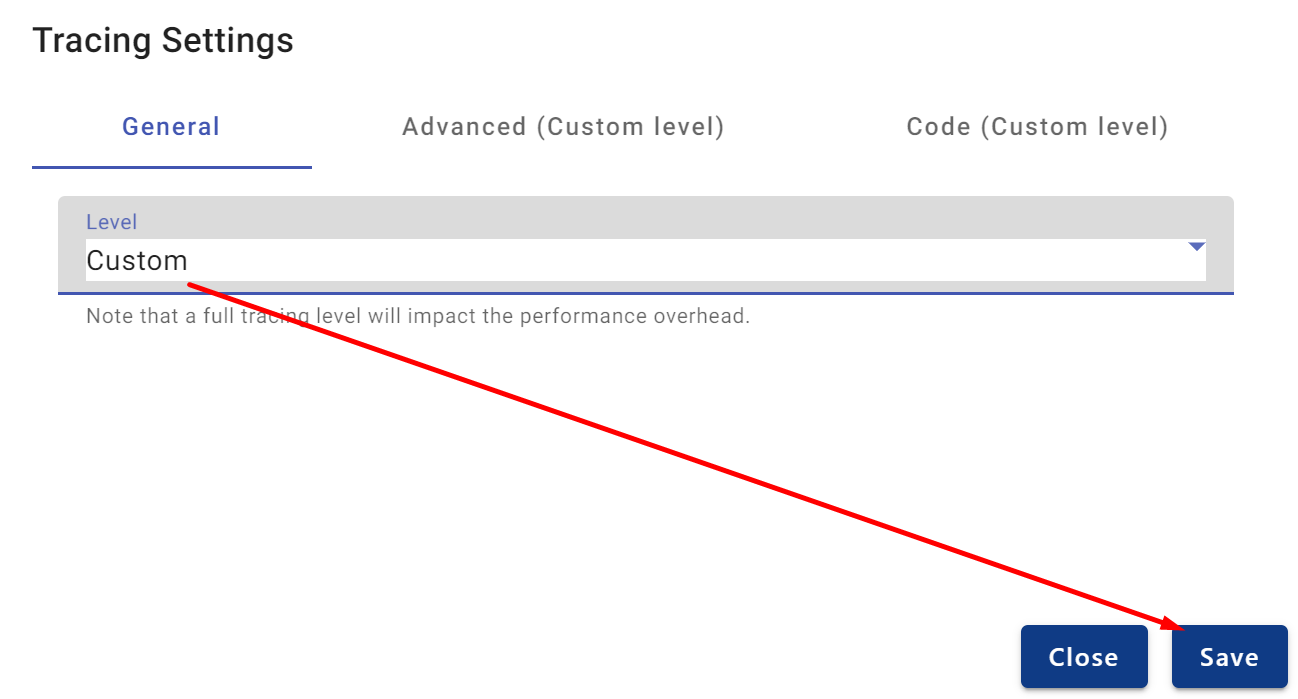
Save. This will start the monitoring process:
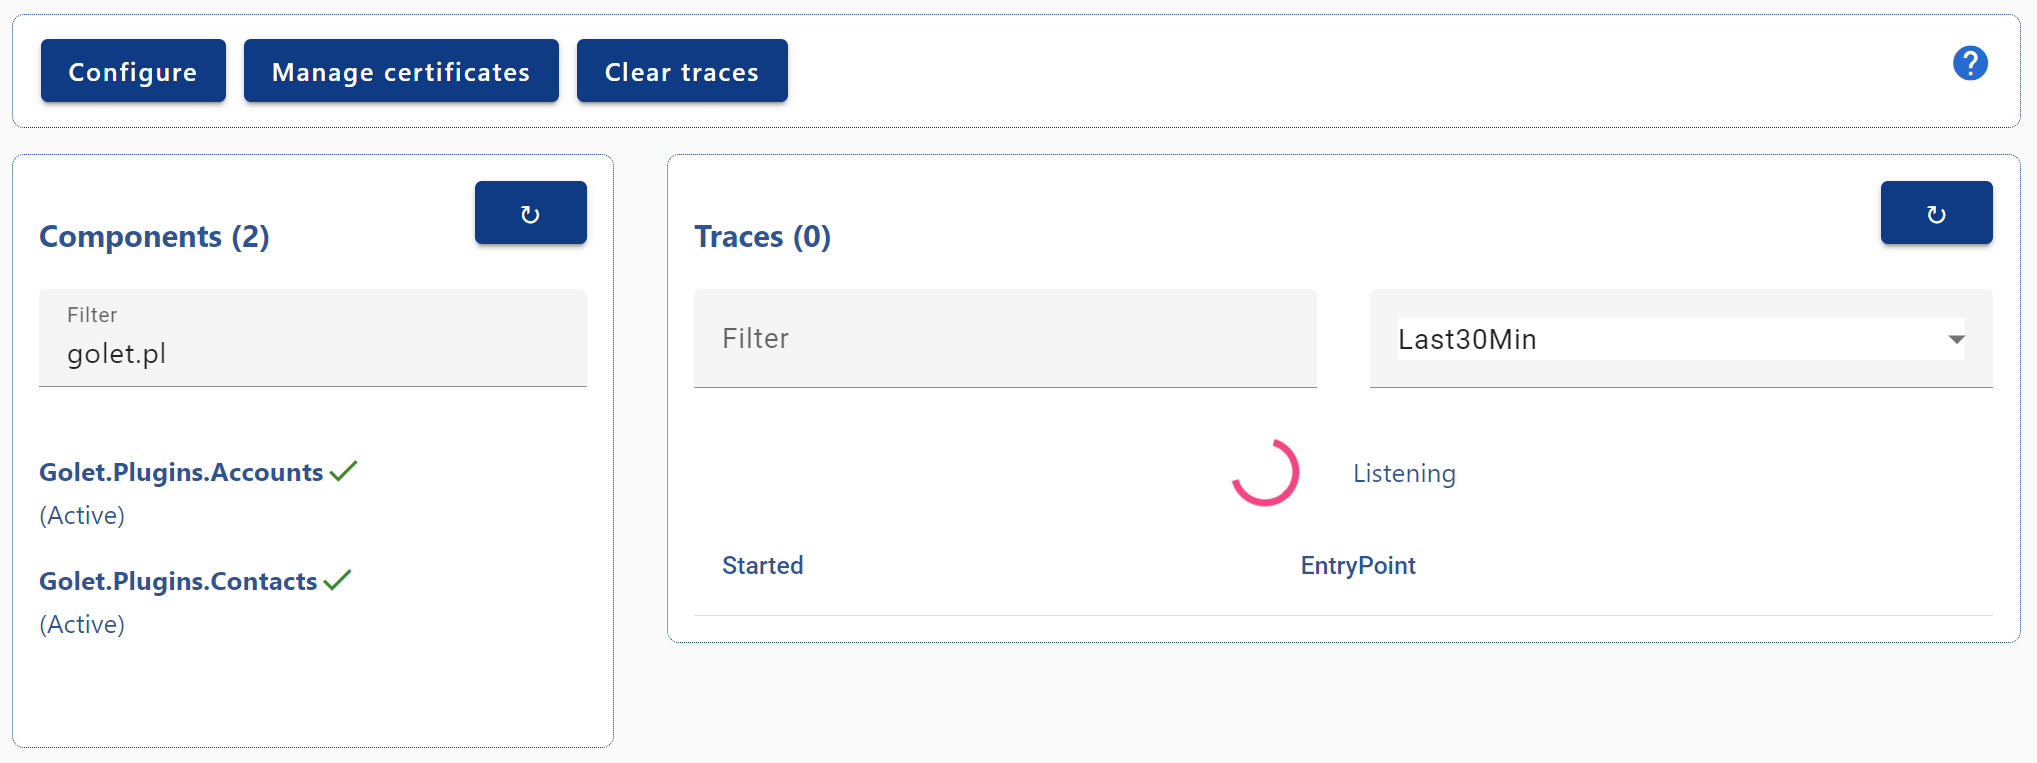
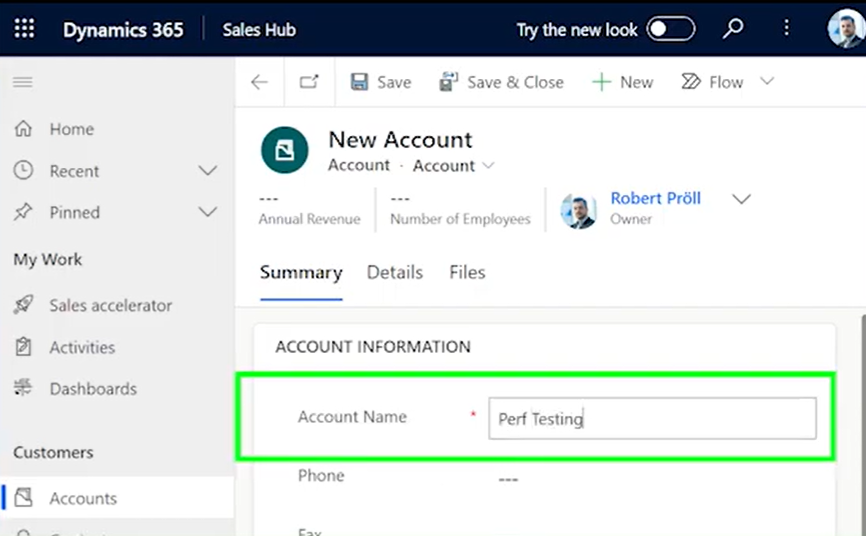
After a few seconds, KPI will start listening. Now trigger any actions that should be traced.
Click on the refresh button, then KPI will show results. The results include every code line executed, bottlenecks in the code base (highlighted by bold font), time of execution and execution statistics.
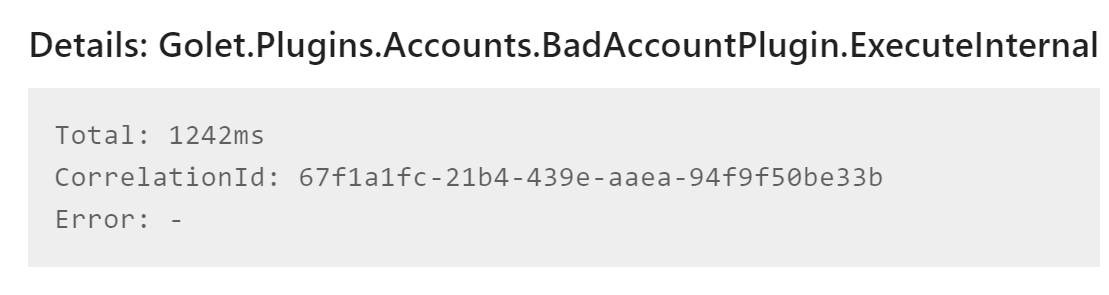
Click on a single entry point to view the detailed stack.
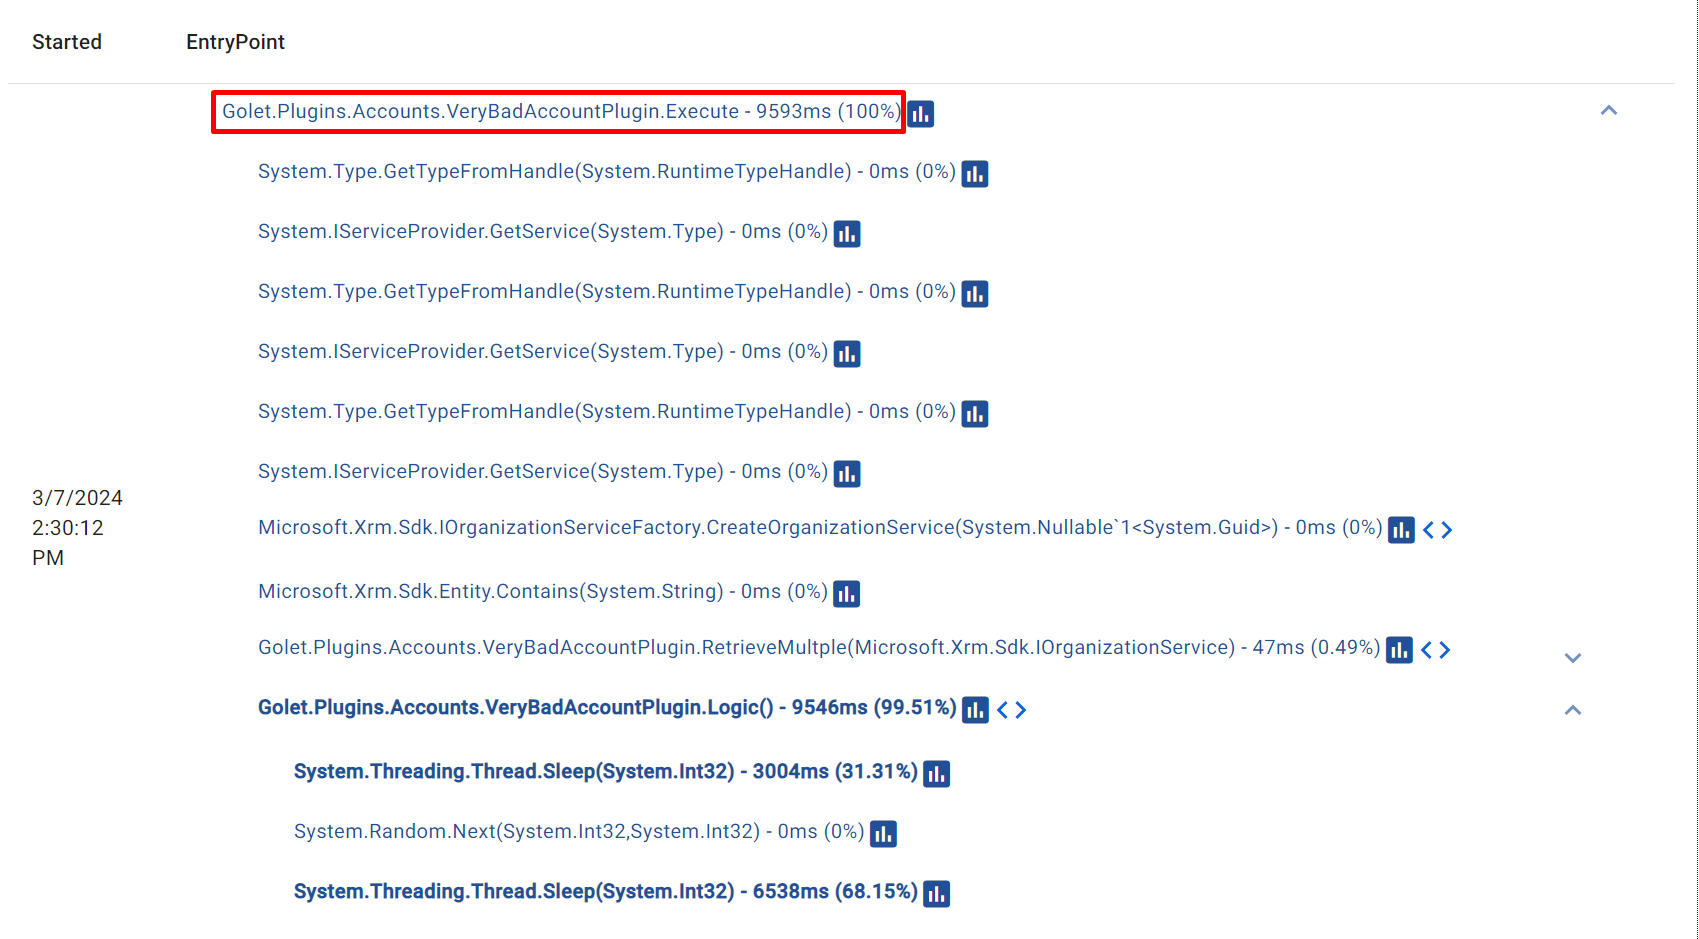
The source code of a selected line can be viewed by clicking on the <> icon.
Component states
State | Description |
|---|---|
Active | Tracing is active |
Inactive | Not traced. |
Missing Certificate | The certificate store does not include a valid public key token which matches |
Unknown | See error details |
Error | The monitoring failed. See error details |
Analyze Traces
Normal execution
One single plugin, without any errors.
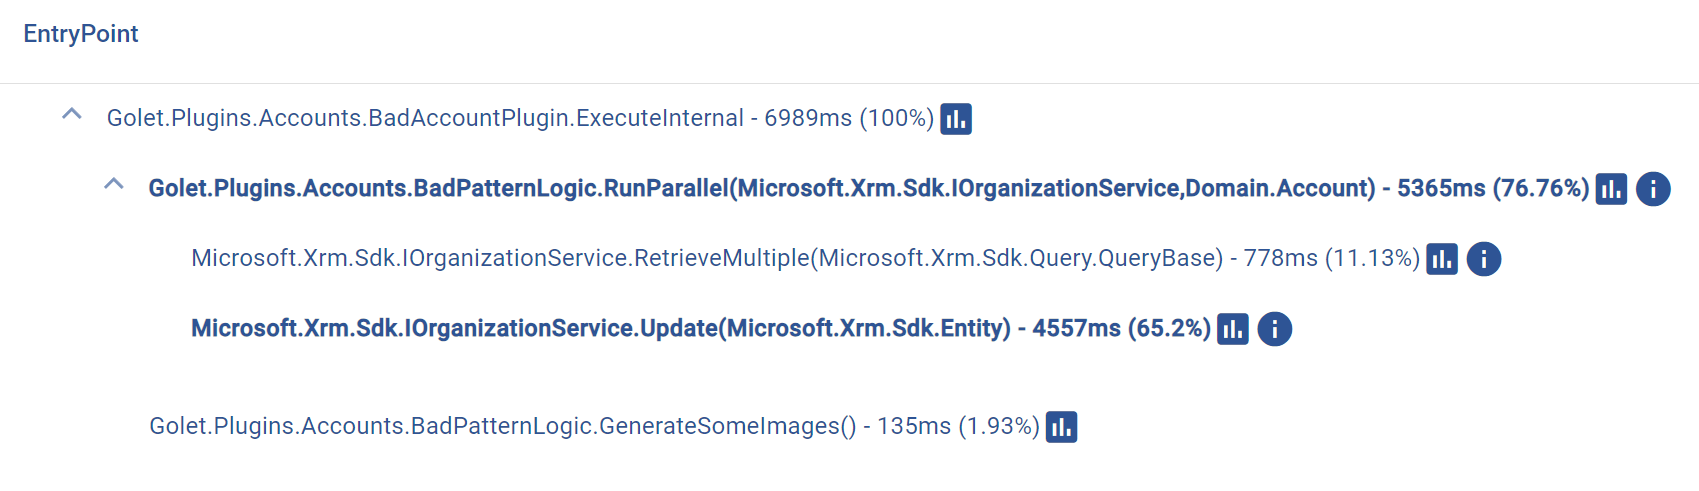
Retrieve multiple query parameter:

Multiple plugins
Three plugins, without any errors.
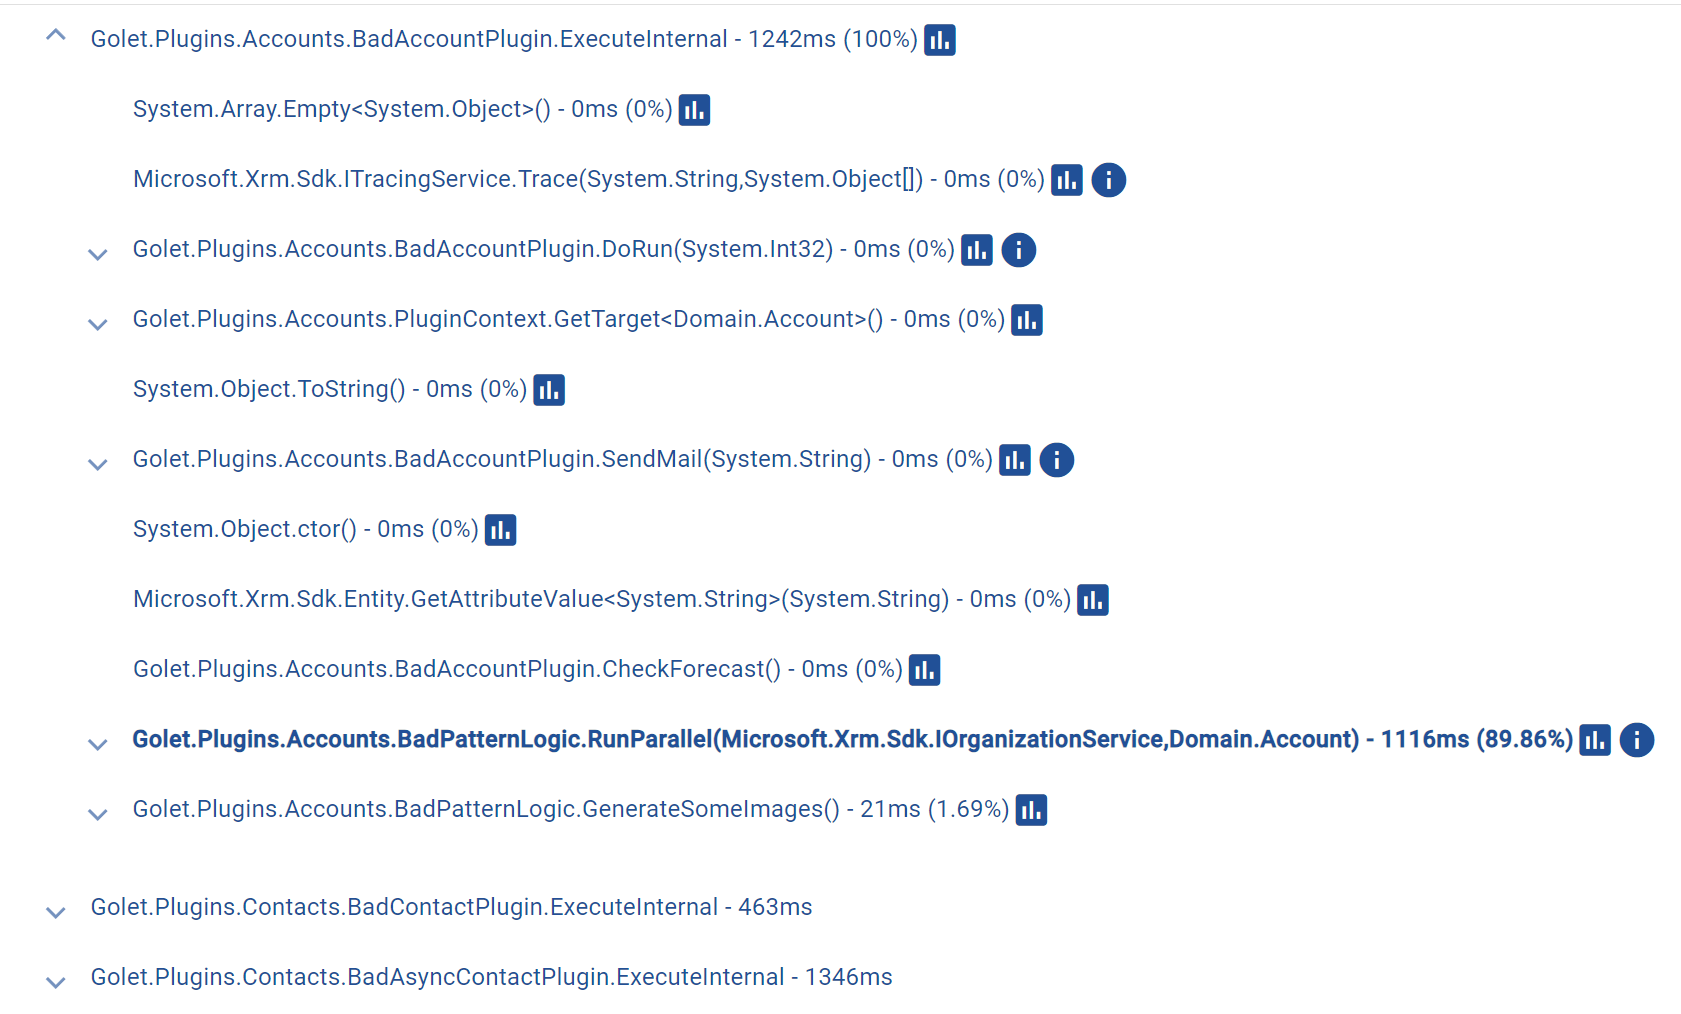
All 3 executions are using the same correlation id:
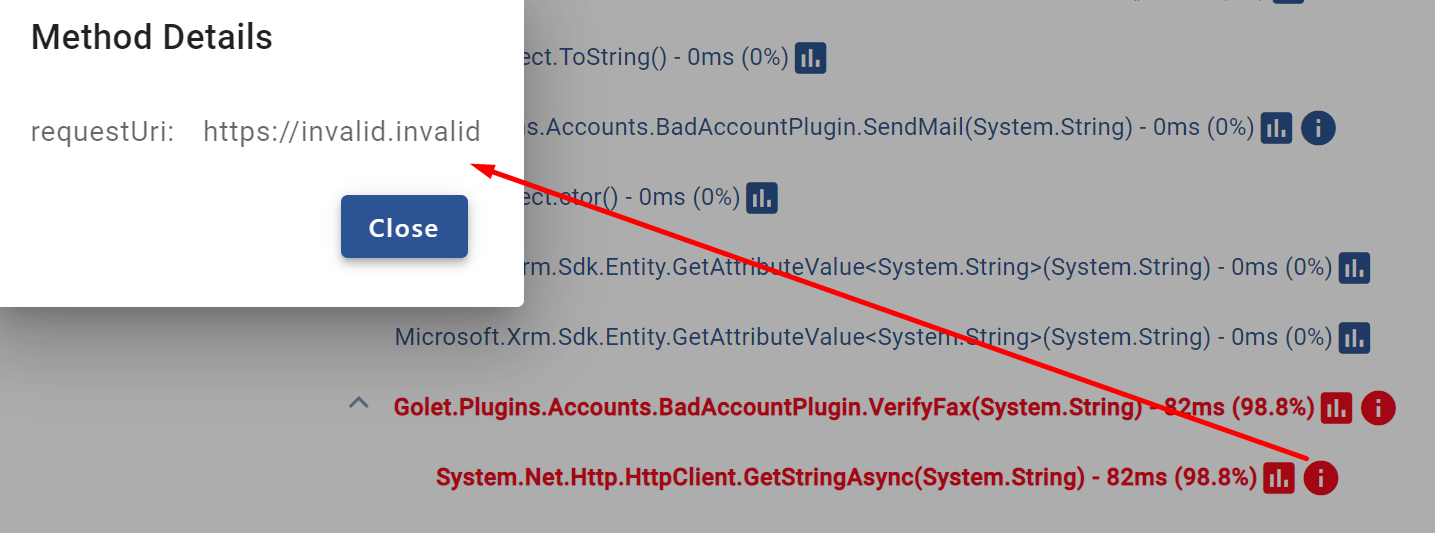
Exceptions
Failed plugin execution, caused by an invalid http request.
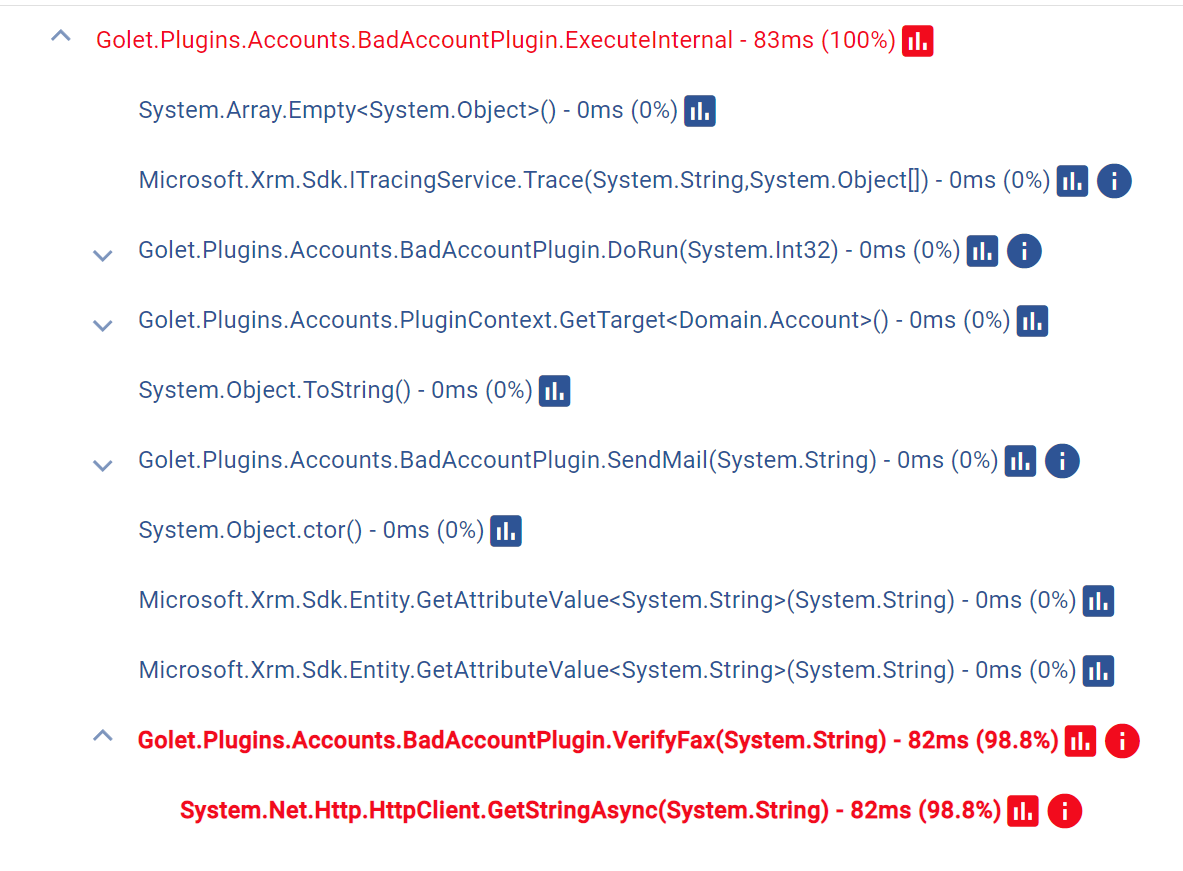
Invalid parameter for http call:
Deployment
KPI automatically checks for changed assemblies, metadata. No configuration needed.
Code Signing (certificate management)
In order to be able to execute the Performance Profiling, a code signing certificate must be uploaded to KPI.
More: Tutorial: Write and register a plug-in (Microsoft Dataverse) - Power Apps | Microsoft Learn
Go to Monitoring, click on “Manage certificates” → Add:
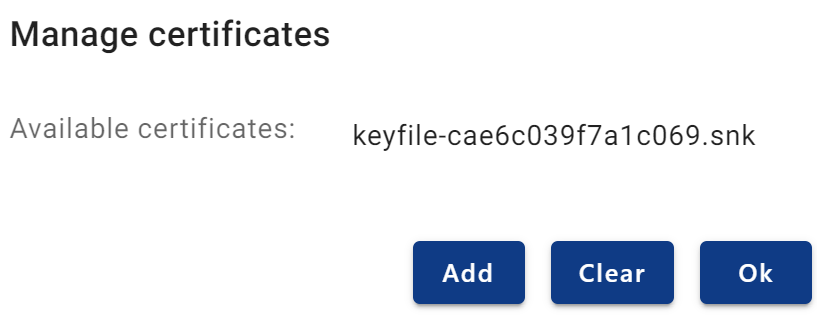
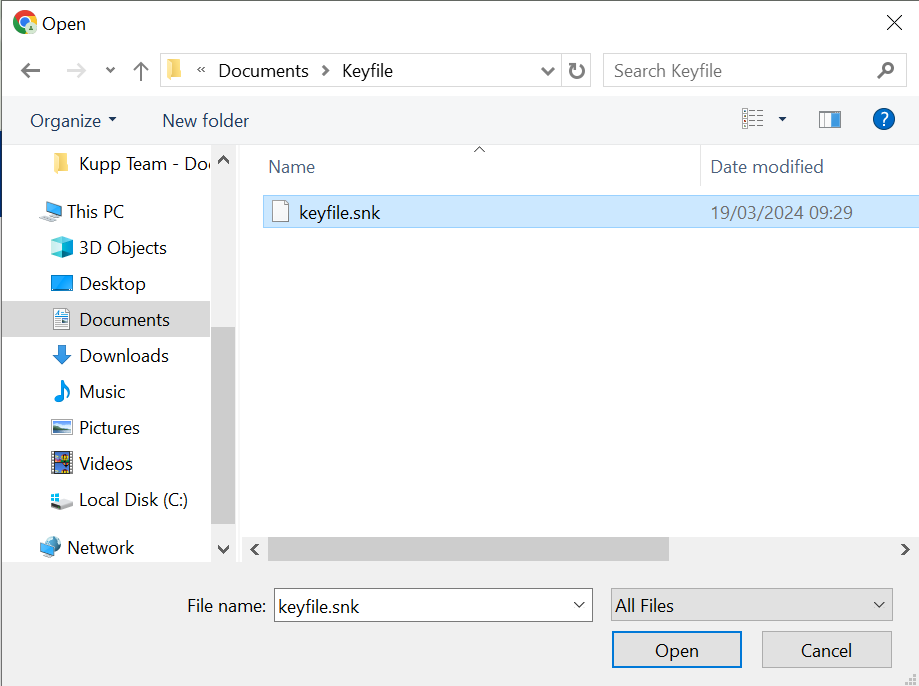
Select the certificate that is used to sign the assemblies.
The used certificate types are SNK files (*.snk). Based on the signing algorithm used when creating the assembly files, the type of the certificate might change.
It is important that the certificate uploaded matches the certificate of the assemblies analyzed by KPI. If there is a mismatch, an error will occur.
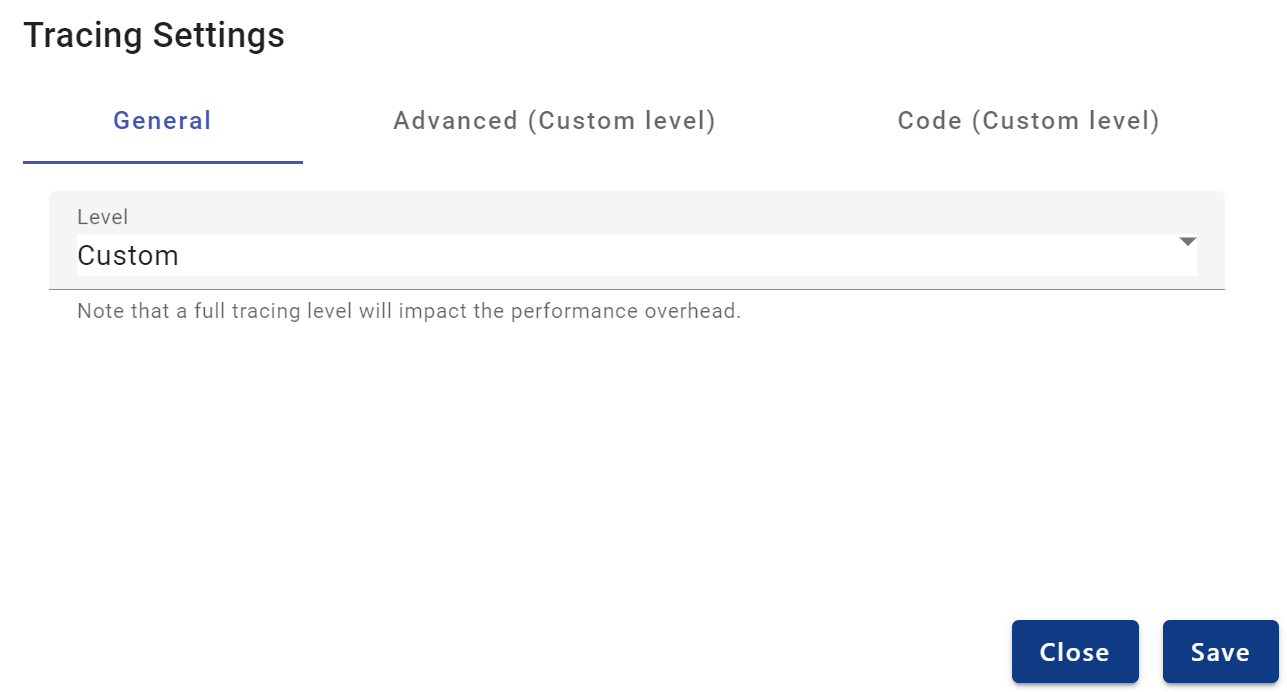
Settings
These settings control how kpi monitors the dataverse environment.
None: No tracing data will be stored.
Custom: Tracing is enabled, based on configured settings.
Code (Custom level)
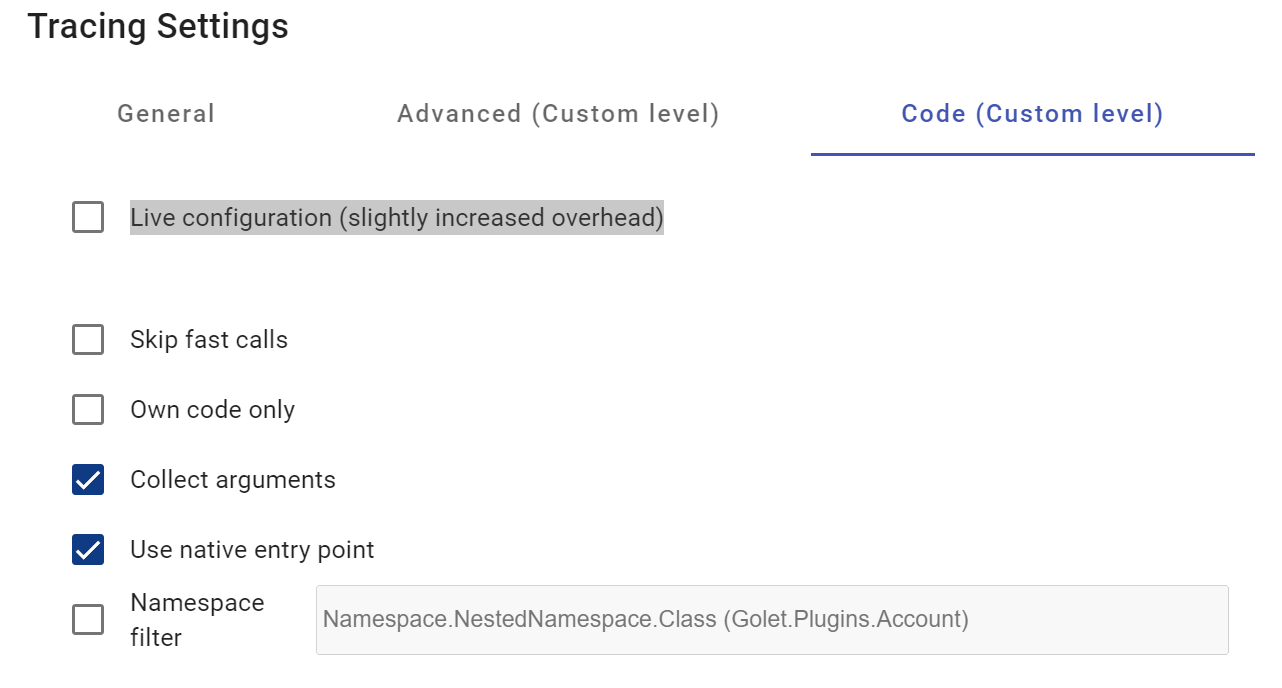
Live configuration (slightly increased overhead): Settings will be cached for 10 minutes. This option disables the cache (not recommended).
Skip fast calls: Excludes operations that were faster than 100 milliseconds in execution time.
Own code only: Excludes lines of code that are not directly written as custom code in a plugin. (e.g. libraries)
Collect arguments: enables KPI to collect execution arguments and shows them at each line.
Use native entry point: Skip abstract implementations of Execute(IServiceProvider)
Namespace filter: Lets the user narrow down which lines should be shown during the tracing.
Advanced (Custom level)
These settings are not applied until the assemblies have been deployed again. Either via direct update or solution import.
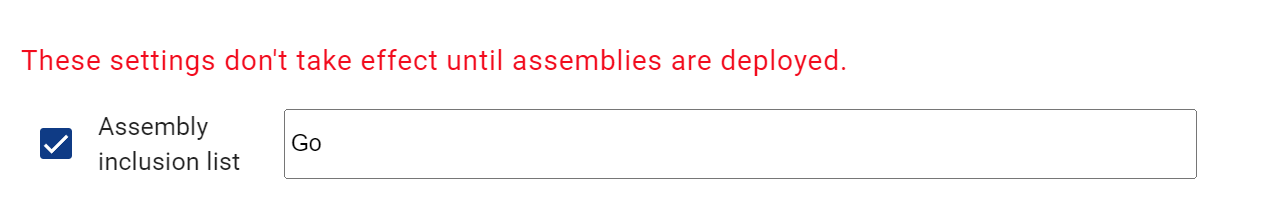
Assembly inclusion list: Define a white list which assemblies should be monitored.
Data Retention
All traces are automatically deleted after 14 days.
Clear Traces
The clear traces button forces a deletion of all traces.

Supported Components / Limitations
KPI supports only server side executions. See Supported Systems and Components
Consumption (Licensing)
See Tenant Settings | Consumption
Troubleshooting / FAQ
This section is currently being updated, some topics may not yet be up to date
Ensure that you have configured your integrations: Integrations and also the code signing has to be configured before the start of the first trace: Power Platform Monitoring | Code Signing